In the dynamic landscape of modern industries and businesses, effective communication and streamlined processes are essential for success.
Flowcharting is an invaluable tool, often overlooked in its simplicity, but with the potential to transform the way we approach problems and design solutions.
The Basics
Diving into flowcharting doesn’t require an engineering degree. With a grasp on the basics, anyone can depict processes and workflows efficiently. If you want to gather even more detailed information about this topic, visit zenflowchart.com.
What is a Flowchart?
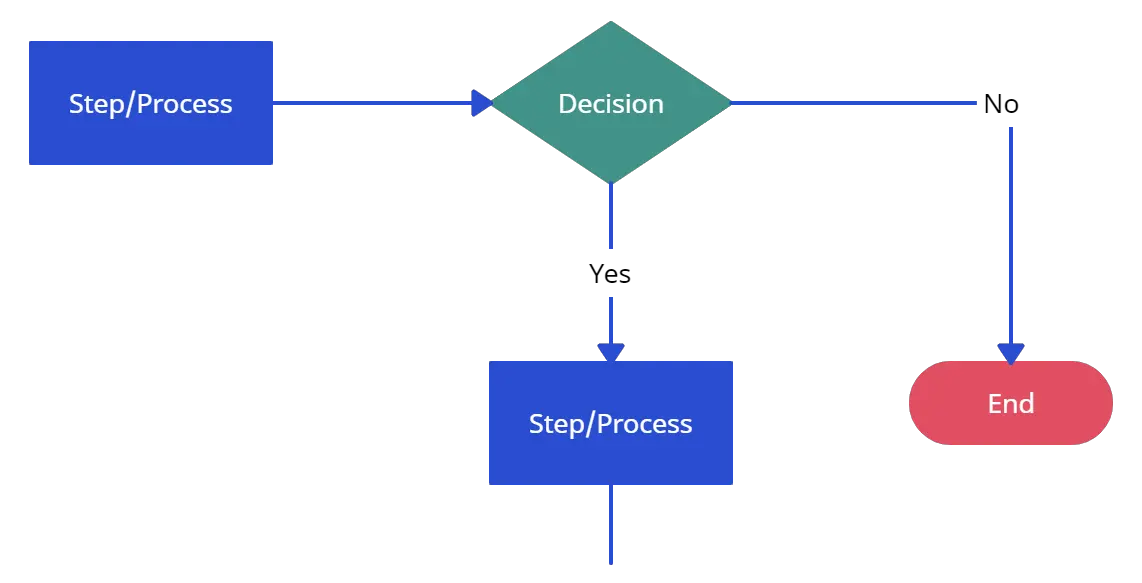
At its core, a flowchart is a graphical representation of a process or workflow. It uses specific symbols connected by lines to represent steps in a process, showcasing the sequence and interactions clearly.
These can vary in complexity, from simple linear processes to intricate multifaceted workflows with decision points and alternative paths.
Common Symbols and Their Meanings
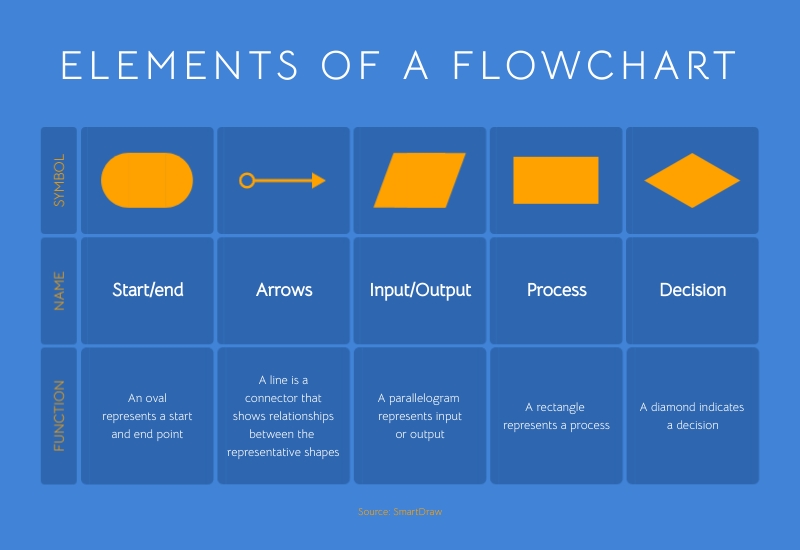
The language of flowcharting is in its symbols. Some of the most widely used ones include rectangles (representing processes), diamonds (indicating decisions), and ovals (denoting start/end points). Arrows guide the viewer, showing the flow’s direction.
Mastery over these symbols is pivotal as they serve as the basic building blocks for any flowchart.
Why are They Essential?
In today’s multifaceted world, the significance of flowcharts extends far beyond just process documentation. They serve multiple purposes, each enhancing our ability to comprehend and optimize operations.
Clarifying Complex Processes
Complex procedures, when described textually, can become muddled and challenging to follow. Flowcharts, however, provide visual clarity, breaking down multifarious tasks into easily digestible steps.
They aid in identifying bottlenecks, redundant steps, and potential areas for improvement, making it easier to streamline operations.
Facilitating Collaboration and Communication

Flowcharts aren’t just tools for individual understanding; they’re also communication aids. A well-designed flowchart can serve as a reference point for teams, ensuring everyone is on the same page.
They foster collaboration by setting a clear visual standard, eliminating ambiguities and misconceptions that can arise from purely textual descriptions.
Pitfalls to Avoid
While flowcharts are potent tools for visualization and process improvement, certain common mistakes can hamper their effectiveness. Being aware of these pitfalls can ensure your flowcharts remain clear and actionable.
Over-complicating the Diagram
As mentioned earlier, simplicity is key. But it’s worth reiterating, given how easy it is to get caught up in the intricacies of a process. An over-complicated flowchart can confuse rather than clarify.
While it’s essential to provide a comprehensive view, avoid diving too deep into micro-tasks. Always question whether each step is vital for the viewer’s understanding.
Ambiguous Symbols and Arrows
The primary purpose of a flowchart is to convey a process clearly. Using too many types of symbols or arrows that crisscross can create ambiguity. Ensure that each symbol’s meaning is clear, and the flow of the process is logical and easy to follow.
Remember, if someone needs to constantly refer back to a legend or guide, the flowchart might not be as intuitive as it should be.
Real-world Applications
Flowcharts aren’t just theoretical constructs; they have tangible impacts in various industries. Understanding these real-world applications can highlight their potential.
Healthcare and Clinical Pathways

In the healthcare sector, flowcharts, often termed clinical pathways, guide patient care. These charts provide a visual representation of the standard care process for a particular disease or condition, ensuring consistency and reducing errors.
The successful implementation of clinical pathways has been shown to improve patient outcomes and streamline healthcare operations.
Software Development and Debugging
In the realm of software, flowcharts play a pivotal role in designing algorithms and debugging processes. Developers often chart out the logical flow of an application or program, helping them identify potential pitfalls or inefficiencies.
Real-world tech giants attribute much of their success to rigorous process visualization and optimization, for which flowcharts have been indispensable.
Crafting Flowcharts for Different Audiences
Every flowchart doesn’t cater to the same audience. Depending on your target viewers, the design and detail level might vary.
Technical Teams
For audiences well-versed in the intricacies of a process, such as software developers or engineers, your flowchart can afford to be more detailed. Use industry-specific symbols or jargon, but ensure there’s a legend for clarity.
Always consider the process complexity and decide if breaking it into multiple linked flowcharts can aid understanding.
Non-technical Stakeholders
When your audience isn’t familiar with the technicalities, simplicity is the mantra. Use basic symbols, avoid jargon, and aim for high-level overviews rather than granular details. Color-coding can be especially effective here, highlighting different stages or responsibilities.
Iterating and Updating Your Flowcharts
A flowchart isn’t a static entity. As processes evolve, so should the diagrams representing them.
Regular Review Cycles
Establish a schedule to revisit and review your flowcharts. This could be quarterly, annually, or after major process changes. Regular reviews ensure that your flowcharts remain relevant and continue to be a valuable resource for your team.
Seek Feedback from Users
Feedback is invaluable. Encourage team members or other flowchart users to suggest changes or points of confusion. This not only improves the chart’s clarity but also fosters a sense of collective ownership and collaboration.
Optimization for Digital Display
As the world goes digital, so do our primary platforms for displaying flowcharts. This transition requires some adjustments to ensure maximum clarity and effectiveness.
Responsive Design Considerations
In an age of diverse screen sizes—from smartphones to widescreen monitors—your flowchart should display clearly across devices. Consider software that offers responsive design capabilities, ensuring your flowchart remains legible and appropriately scaled, regardless of the viewing platform.
Interactive Elements
Digital displays allow for interactivity, an element unavailable in traditional paper flowcharts. Use clickable sections that expand for more detail, hover tooltips for added context, or even embedded links to related documents or resources.
These interactive elements can elevate the user’s experience and provide additional depth without overwhelming the primary chart.
Conclusion
From the foundational symbols that define each step to the strategic arrangement of elements that tell a story, mastering flowcharting can unlock new dimensions of clarity and efficiency across industries and disciplines.
Always remember that practice is key. The more you engage with flowcharting, the more adept you will become at transforming complex processes into intuitive visuals.