

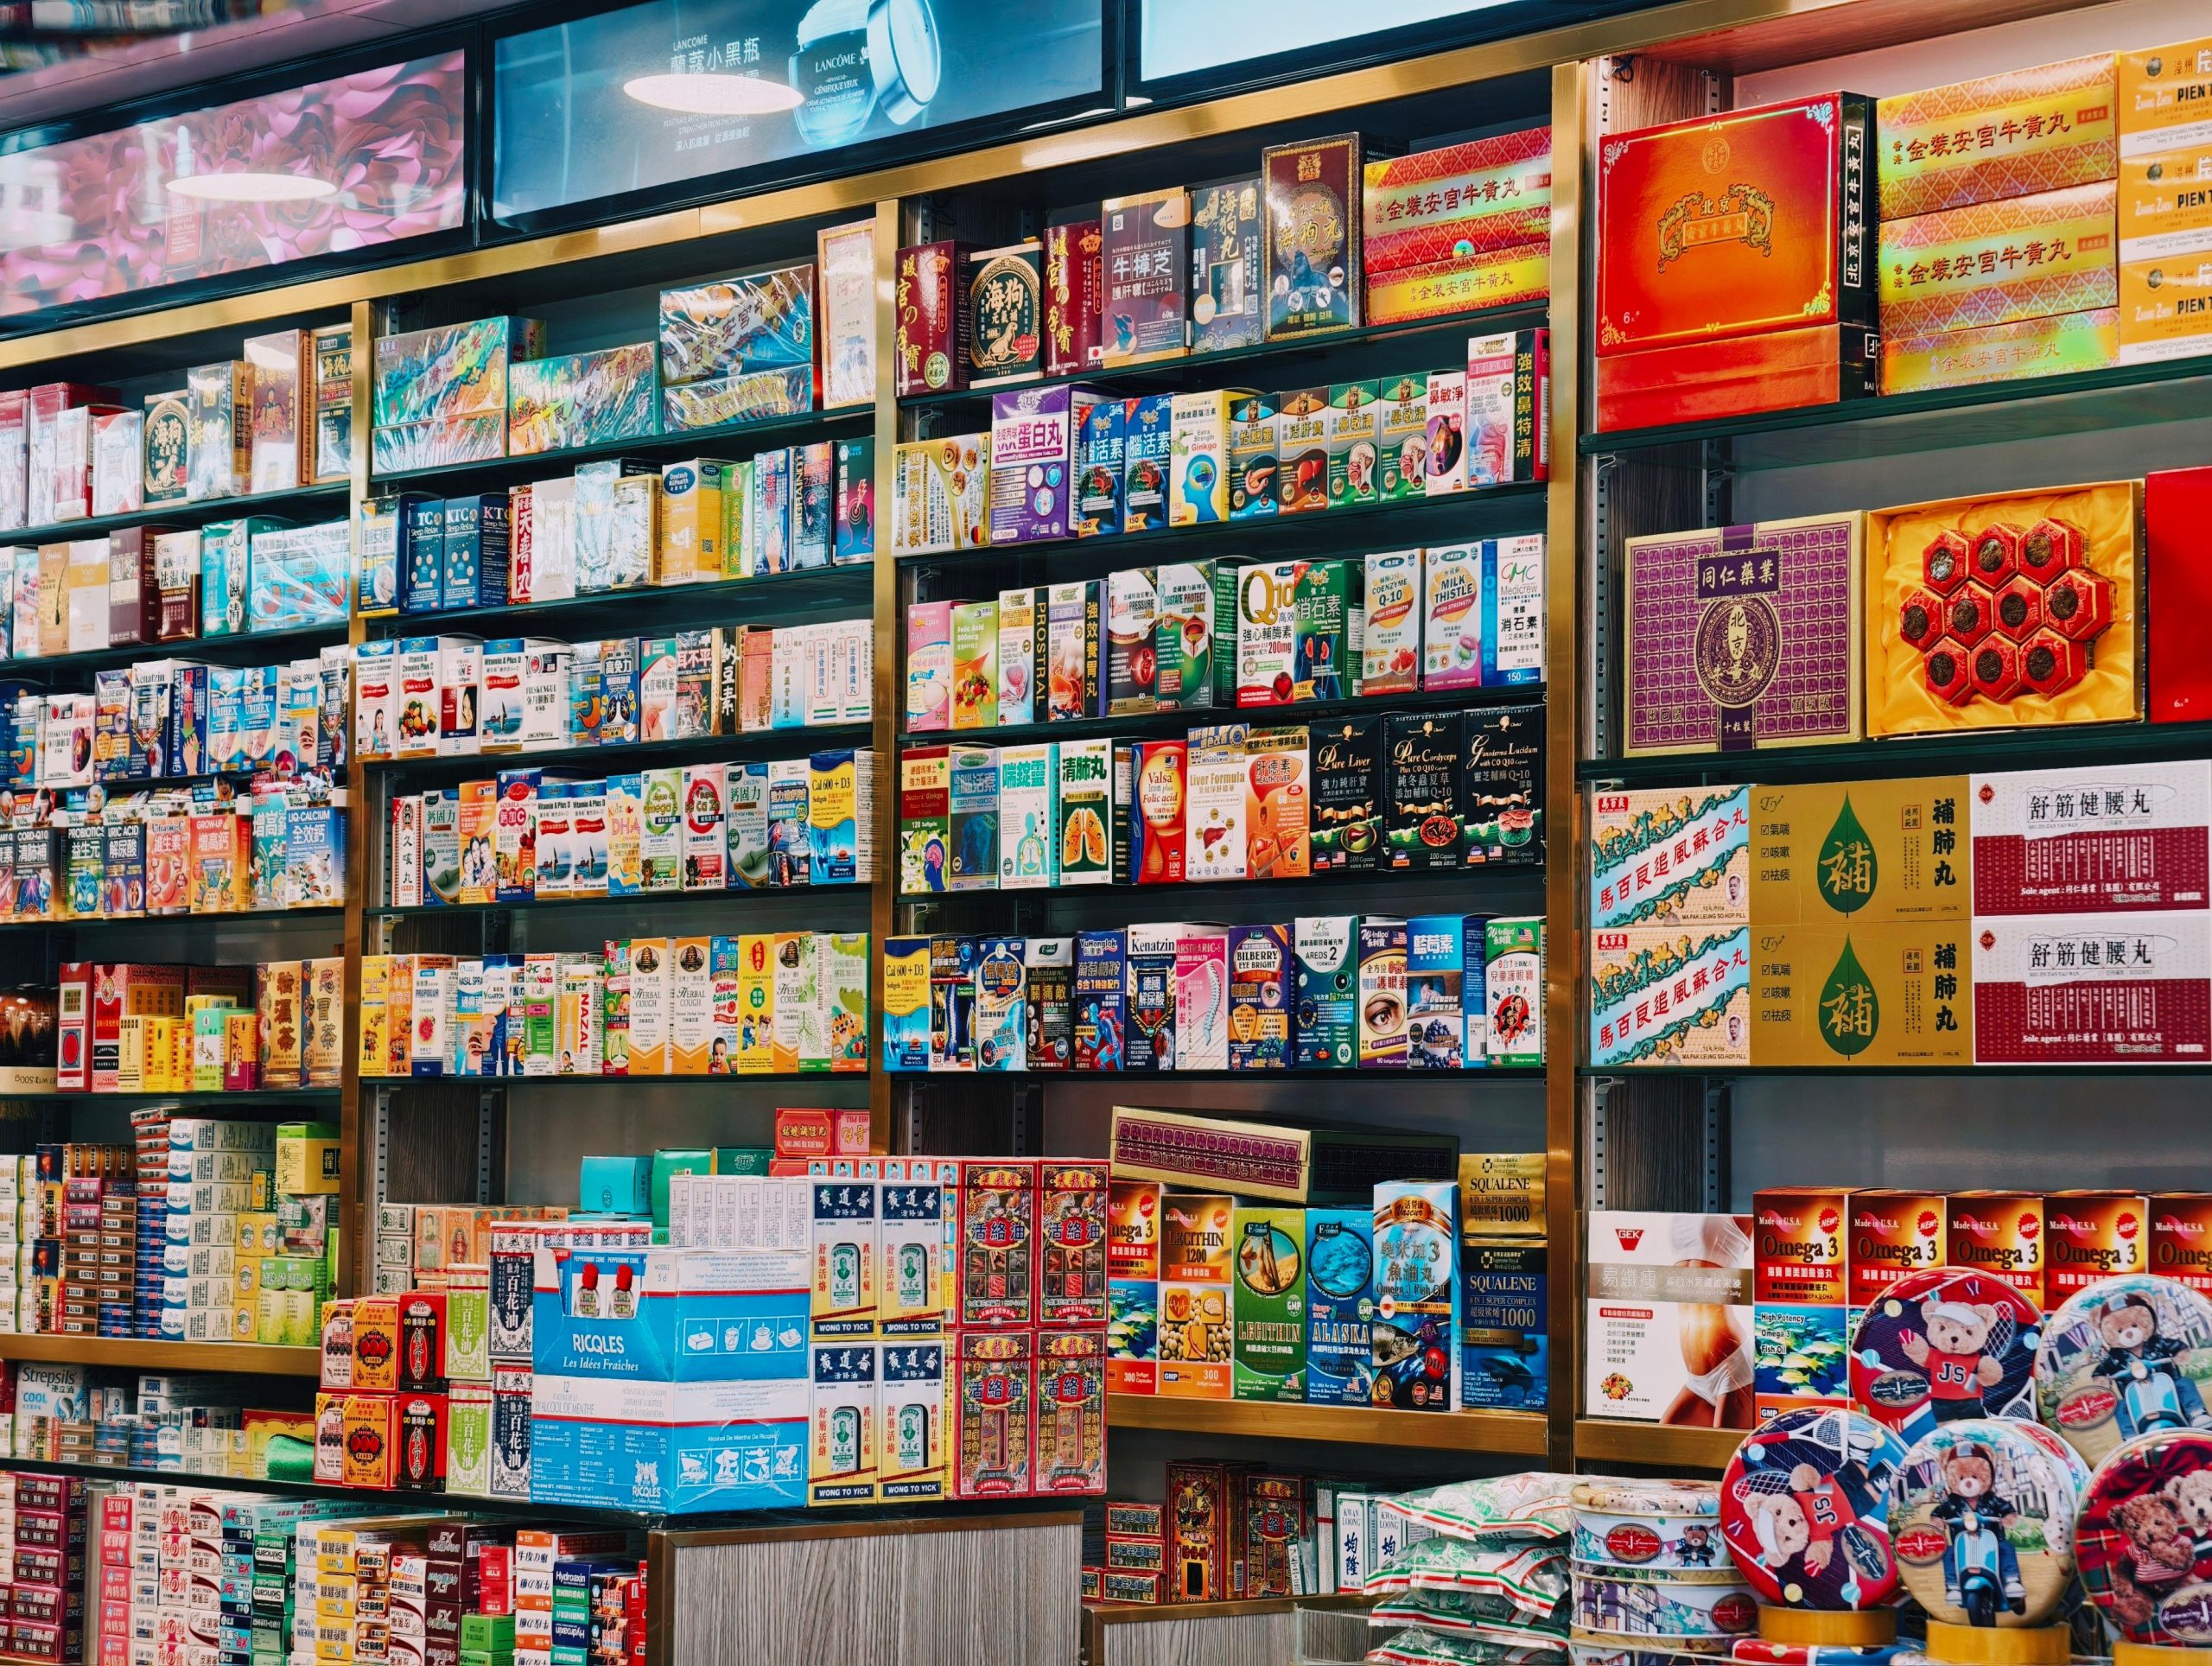
Start with a number that is not a marketing slogan. In 2013, a German perfumery chain took eight products off their usual shelves and placed them in plain acrylic boxes near the tills in 214 stores. Sales of those products rose by somewhere between 80% and 478%, depending on the item, adding about €218 a week per store. The displays were deliberately unglamorous. No screens, no theatre – just the right product standing in the right few feet of floor.
That result is the whole subject in miniature. Displays do not hypnotise us into wanting things we never wanted. They slot a product into a decision we were already about to make, at a moment when thinking is cheap and refusing is expensive. What follows is about which parts of that mechanism are real, which are folklore, and where stores reliably get it wrong.

The stat everyone quotes is shakier than it looks
Ask anyone in retail how much we decide inside the store and you will hear a version of 70%. It traces to a 1995 study by the Point-of-Purchase Advertising Institute (POPAI) and Meyers Research, which broke decisions at the point of purchase into 6% (planned the product, not the brand), 4% (brand switches) and 60% unplanned. A 2014 POPAI report pushed the headline to 82%. Then it started travelling: repeated in decks, misattributed to Deloitte, cited by people who had never opened the original.
The problem is the definition. Anything bought that a shopper had not named by brand before walking in counted as an in-store decision. Choose ketchup, buy the ketchup you always buy, and you are logged as a spontaneous decision. Independent estimates land lower – a 1967 study at about 50.5%, a 1998 study at 59.1%, and an OgilvyAction survey at 39%. (The 1995 research was funded by an institute that existed to sell in-store advertising, which is worth remembering when a figure keeps being quoted at you.)
I think the 70% survives because it flatters almost everyone involved – the agencies, the display manufacturers, the brands paying for the endcap. The honest version is less quotable: unplanned buying is large but varies enormously by category. Kantar’s shopper data from July 2025 found that in the classic impulse categories – chocolate, confectionery, biscuits, salty snacks and fizzy drinks – more than 75% of purchases are now planned before the shopper even enters the store, because phones and loyalty apps moved the decision upstream, as Kantar’s analysis of the shift to planned impulse buying sets out. That is an awkward finding for anyone selling the idea that the aisle is a blank slate.
So the interesting question is not “how many of our choices happen in the shop.” It is what a display does to the choices that genuinely are still open when the shopper is standing in front of it.
What actually happens in the second before an unplanned buy
The most useful model of the timing comes from a grocery simulation run by Francesco Massara. Unplanned purchases were rare during the first quarter of a shopping trip and became most likely in the last quarter, and that pattern held even for participants working from a list. Without a list, the odds of an unplanned purchase or a brand switch were almost twice the odds of a planned one. The reading is unromantic: self-control is a running cost, and by the end of a trip the budget is mostly spent.
Then there is effort. In an in-store experiment in Iceland, a potato-chip brand on the middle shelf outsold the same brand on the high and low shelves; when researchers added a large single-brand display near the store entrance, the brand’s share of its category climbed from roughly 5% to about 12.6%. Nothing about the product changed. The only thing that changed was how little work it took to see it, reach it, and drop it in the trolley.
That is the quiet engine under every good display. It does not manufacture desire. It removes friction from a desire that already existed at a low level, and it catches the shopper at the point where attention is cheap and patience is thin.
Why the checkout is the most profitable metre in the store
Point of sale display stands earn their keep by sitting where a shopper already is – beside the till, at the end of an aisle, on the walking line between two things they actually came for. The checkout is the highest-value stretch of floor in most shops precisely because nobody has to be persuaded to arrive there.
This is where the German perfumery result matters most, published by Weimar, Deutscher and Decker in the Journal of Business & Retail Management Research. Moving eight products into checkout boxes lifted sales for every single one, but the size of the lift varied wildly: lip gloss nearly quintupled, while mascara did not even double. The researchers could not fully explain the differences from price, product type or time in the range.
That gap is the honest lesson. Placement reliably helps; the size of the help is not something anyone can promise you in advance. And the products that benefit most tend to be cheap, small and low-risk, because the decision costs almost nothing – which is exactly why the till mat is stacked with them.
The money is real, though. Optimum Retailing’s July 2025 survey of 1,000 US consumers found 72% had made an unplanned in-store discretionary purchase in the previous month. The most-cited driver was a limited-time sale (55%), followed by attention-grabbing product displays (45%). Read those two figures in order. The discount outranks the display. A beautiful stand with no reason to buy is decoration, and decoration does not move units.
Eye level isn’t always buy level
“Eye level is buy level” is the oldest rule in planogram design, and the classic field work partly supports it. Dreze, Hoch and Purk’s shelf experiments found vertical position mattered more than the number of facings, and that moving a brand from the worst to the best vertical slot changed sales by roughly 39% on average, rising to about 59% when horizontal position was improved too. Moving toothbrushes down to eye level lifted sales by 8%.
But measured shopper behaviour complicates the slogan. An in-store eye-tracking study by Atalay and colleagues found the shelf level capturing the most attention was about 14.7 inches below eye level – around chest height – and that shoppers looked more at products on their right as they walked, as reported in the Journal of Marketing Research. A 2023 convenience-store field experiment found the eye-level effect appeared only under certain ways of reshuffling the whole shelf: lifting a product to eye level added 5.6% to 10% under one reorganisation and nothing measurable under another.
So position matters a great deal, but “eye level” is a shortcut, not a law. The effect depends on what else moved, what the shopper was already looking for, and which side of the aisle they were on.
Where the clever displays backfire
The more elaborate the display, the less predictable the payoff. A large field study across 237 digital advertising campaigns and 30 million shoppers found that in-store screens raised the chance a shopper bought the featured product by 8.1% on average – stronger for hedonic, novel and low-priced products, for popular brands, and when the screen sat close to the product. But an earlier set of field experiments found digital displays lifted sales in hypermarkets, barely mattered in supermarkets, and actually hurt sales in small convenience stores. Context decides whether the screen is a nudge or a distraction.
Vividness has a ceiling, too. Field tests of animated projections on supermarket endcaps found an inverted-U relationship: moderately vivid beat both a plain endcap and a highly vivid one. Adding sound helped sales; adding scent did nothing. Meanwhile, triggering an indulgent-product display next to healthy food reduced healthy sales by 12.9% in a study of 7,510 shopping baskets. Displays do not only lift the product on the stand. They shift what the shopper talked themselves out of.
Scent and music, the classic “atmospherics,” are real but modest. A meta-analysis of 66 experiments found small-to-medium effects on pleasure, satisfaction and purchase intention. A separate synthesis of scent studies put the average increase in customer responses at 3% to 15%, with the largest effects in the most favourable conditions. My read is that these levers are worth having and not worth building a strategy on. I would bet most independent retailers overspend on spectacle and underinvest in the boring stuff – a full shelf, a legible price, a product the shopper can reach without kneeling.
The evidence, side by side
The studies below used different stores, products and methods, so the numbers are not directly comparable. What they do show is how much the size of a display effect swings with context – while the direction is consistently upward.
Figures are as reported in each study and reflect the specific product, store and period tested; they are directions, not guarantees. The two extremes – Nordfält’s design result and the German checkout data – came from single chains and should be read as best cases, not averages.
What I would actually take from all this
Unplanned buying is better understood as a design outcome than a character flaw. The store is making small decisions on your behalf at the exact points where your attention is cheapest and your resistance is lowest: the entrance display, the endcap, the last few metres before the till. That is not sinister, and it is not hypnosis. It is merchandising doing its job.
For a shopper, the practical implication is not “make a list.” List-makers in Massara’s study ended up making proportionally more unplanned purchases late in the trip anyway. The risk concentrates in the final stretch, when the trolley is nearly full and the resolve is nearly gone. Leaving the phone in your pocket and declining the second loop past the seasonal aisle does more than a perfectly disciplined plan.
For a retailer or a brand, the evidence points away from spectacle and toward fit. Place the product inside a path people already walk. Make the reason to buy obvious without being loud. Keep the shelf full and the price legible. Moderate, well-sited, well-stocked displays beat dramatic ones almost every time the research has bothered to measure it – which is a less exciting headline, and a more profitable one.