

Ten seconds sounds like a nice round number someone picked for a headline. It isn’t. It’s the actual cutoff Google Analytics 4 uses to decide whether a visit counts as an “engaged session” at all – a session only qualifies once it lasts longer than ten seconds, includes a key event, or reaches a second page. Everything short of that gets bucketed as a bounce. So when a business owner asks why people leave in the first ten seconds, they’re not asking about a vague impression – they’re asking about the exact line most modern web analytics draws between “this visit counted” and “this visit didn’t.”

What’s more interesting than the number itself is how much happens inside it. It isn’t one decision. It’s several small, fast, mostly unconscious verdicts stacked on top of each other, and each one has its own research behind it.
The verdict that lands before anyone reads a word
The first judgment isn’t about your content, your offer, or your headline. It’s purely visual, and it happens in about the time it takes to blink. Researcher Gitte Lindgaard and colleagues ran a study – since cited more than a thousand times – showing that people form a reliable opinion of a webpage’s visual appeal after seeing it for just 50 milliseconds. Her own summary of the finding is blunt: “web designers have about 50 ms to make a good first impression.” Fifty milliseconds. Not five seconds. Fifty milliseconds, before a visitor has consciously registered a single sentence.
That snap judgment isn’t cosmetic vanity, either. In one of the largest web credibility studies on record, Stanford’s Persuasive Technology Lab had nearly 2,700 people evaluate real websites and found that “design look” – layout, typography, color, general polish – showed up in 46.1% of all the comments people made about whether a site felt trustworthy. Far more than content accuracy, far more than company reputation. People decide a site is credible mostly by how it looks, then backfill reasons afterward.
Seconds one through five: does this even apply to me?
Once past that instant visual filter, the next few seconds are spent answering a much narrower question: is this for me, and does it do the thing I came here expecting it to do? This is the headline-and-hero-image window. Nielsen Norman Group’s long-running research on page-visit behavior found that the probability of leaving is very high during the first few seconds because visitors arrive skeptical by default – they’ve been burned by enough bad pages that skepticism is the safe starting posture.

If the page survives that, NN/g’s data shows the leaving rate stays elevated through roughly the 10-to-20-second mark, then finally flattens around 30 seconds. Past that point, people who are still there tend to stay much longer – often minutes, which on the web is closer to an eternity than a compliment. So the real prize isn’t “impress them instantly.” It’s “survive the first 30 seconds,” and the first ten to twenty of those are the steepest part of the cliff.
The three-second wall nobody’s UX budget accounts for
Speed is the most measured, most quoted, and – I’d argue – most misunderstood variable in this whole conversation. The headline numbers are real: a 2026 analysis of page-speed data from Searchlab’s website performance benchmarks shows bounce rate climbing steeply as load time increases.
| Page load time | Typical bounce rate |
|---|---|
| 1–2 seconds | 9% |
| 2–3 seconds | 24% |
| 3–5 seconds | 38% |
| 5–10 seconds | 53% |
Source: Searchlab, Website Speed & Performance Statistics 2026. Figures reflect aggregated field data current as of March 2026 and vary by industry and device.
Google’s own research with SOASTA back in 2017 found that as mobile load time went from one second to three, the probability of a bounce rose 32%; stretch that to ten seconds and it rises 123%. LogicMonitor’s 2026 performance report puts a similarly hard number on mobile specifically: 53% of mobile visitors abandon a page that takes longer than three seconds to load, and 47% of consumers expect a page to load in two seconds or under.
Here’s my actual disagreement with how most businesses respond to this data: they treat speed as the whole game, when speed is increasingly table stakes rather than a differentiator. The HTTP Archive’s Web Almanac found that 48% of mobile sites now pass all three Core Web Vitals thresholds, up from 32% in 2021 – the gap is closing, which means shaving another 200 milliseconds off your load time buys you less competitive advantage than it did five years ago. Meanwhile Contentsquare’s 2026 Digital Experience Benchmark found that slow-load frustration dropped 20% year over year, now affecting only about 1 in 10 sessions – but frustration from API errors rose 16% in the same period. The bottleneck is migrating. If your whole redesign budget is still aimed at load time and nothing else, you may be optimizing the problem everyone already half-fixed while ignoring the one that’s currently getting worse.

Mobile doesn’t fail the same way desktop does
It’s tempting to treat “mobile-friendly” as a checkbox next to “responsive design.” The data says the failure mode is different in kind, not just degree. A 2026 compilation of website abandonment statistics found that 73.1% of web designers cite lack of mobile optimization as the primary reason visitors abandon a site, and that users are roughly five times more likely to abandon a site that isn’t properly optimized for the device in their hand.
Part of this is thumbs, not eyes. Interaction-based frustration – what analytics platforms call rage clicks and dead clicks (tapping something that looks interactive but isn’t) – shows up disproportionately on mobile, where tap targets are smaller and layouts get more crowded. This is a different diagnosis than “the page is slow,” and it needs a different fix: bigger buttons, fewer overlapping elements, and testing on an actual phone over cellular data rather than a resized browser window on office wifi.

The credibility killers that have nothing to do with speed
A fast, well-organized page can still get abandoned in seconds if it looks wrong. Circling back to that Stanford credibility research: after design look, the next biggest driver of trust judgments was information structure – whether the page seemed organized, at 28.5% of comments – followed by whether the content actually matched what the visitor expected to find. Typographical errors and broken links, the study found, hurt credibility about as much as a company visibly having financial or legal trouble. That’s a strange thing to sit next to a typo, but it’s what the data showed.
Aggressive popups belong in this bucket too, not the speed bucket. A discount modal that fires the instant the page loads is asking for a commitment before offering anything in return, and Google has penalized intrusive mobile interstitials in search rankings for years now. Stock photography that could belong to literally any company in the category does something similar – it doesn’t slow the page down, but it quietly tells a skeptical visitor that nobody bothered to make this specific to them.
An honest complication: not every fast exit is a failure
Here’s where I’ll push back on the framing of this whole topic a little. Treating every quick exit as a symptom of a broken page assumes the visitor wanted to stay in the first place. Search analysts have documented something called “good abandonment” – a searcher who gets their answer directly from a snippet or a quick scan and leaves satisfied, having gotten exactly what they came for. A blog post that answers a specific question in the first two sentences and gets abandoned after fifteen seconds isn’t necessarily broken; it may have just worked efficiently.
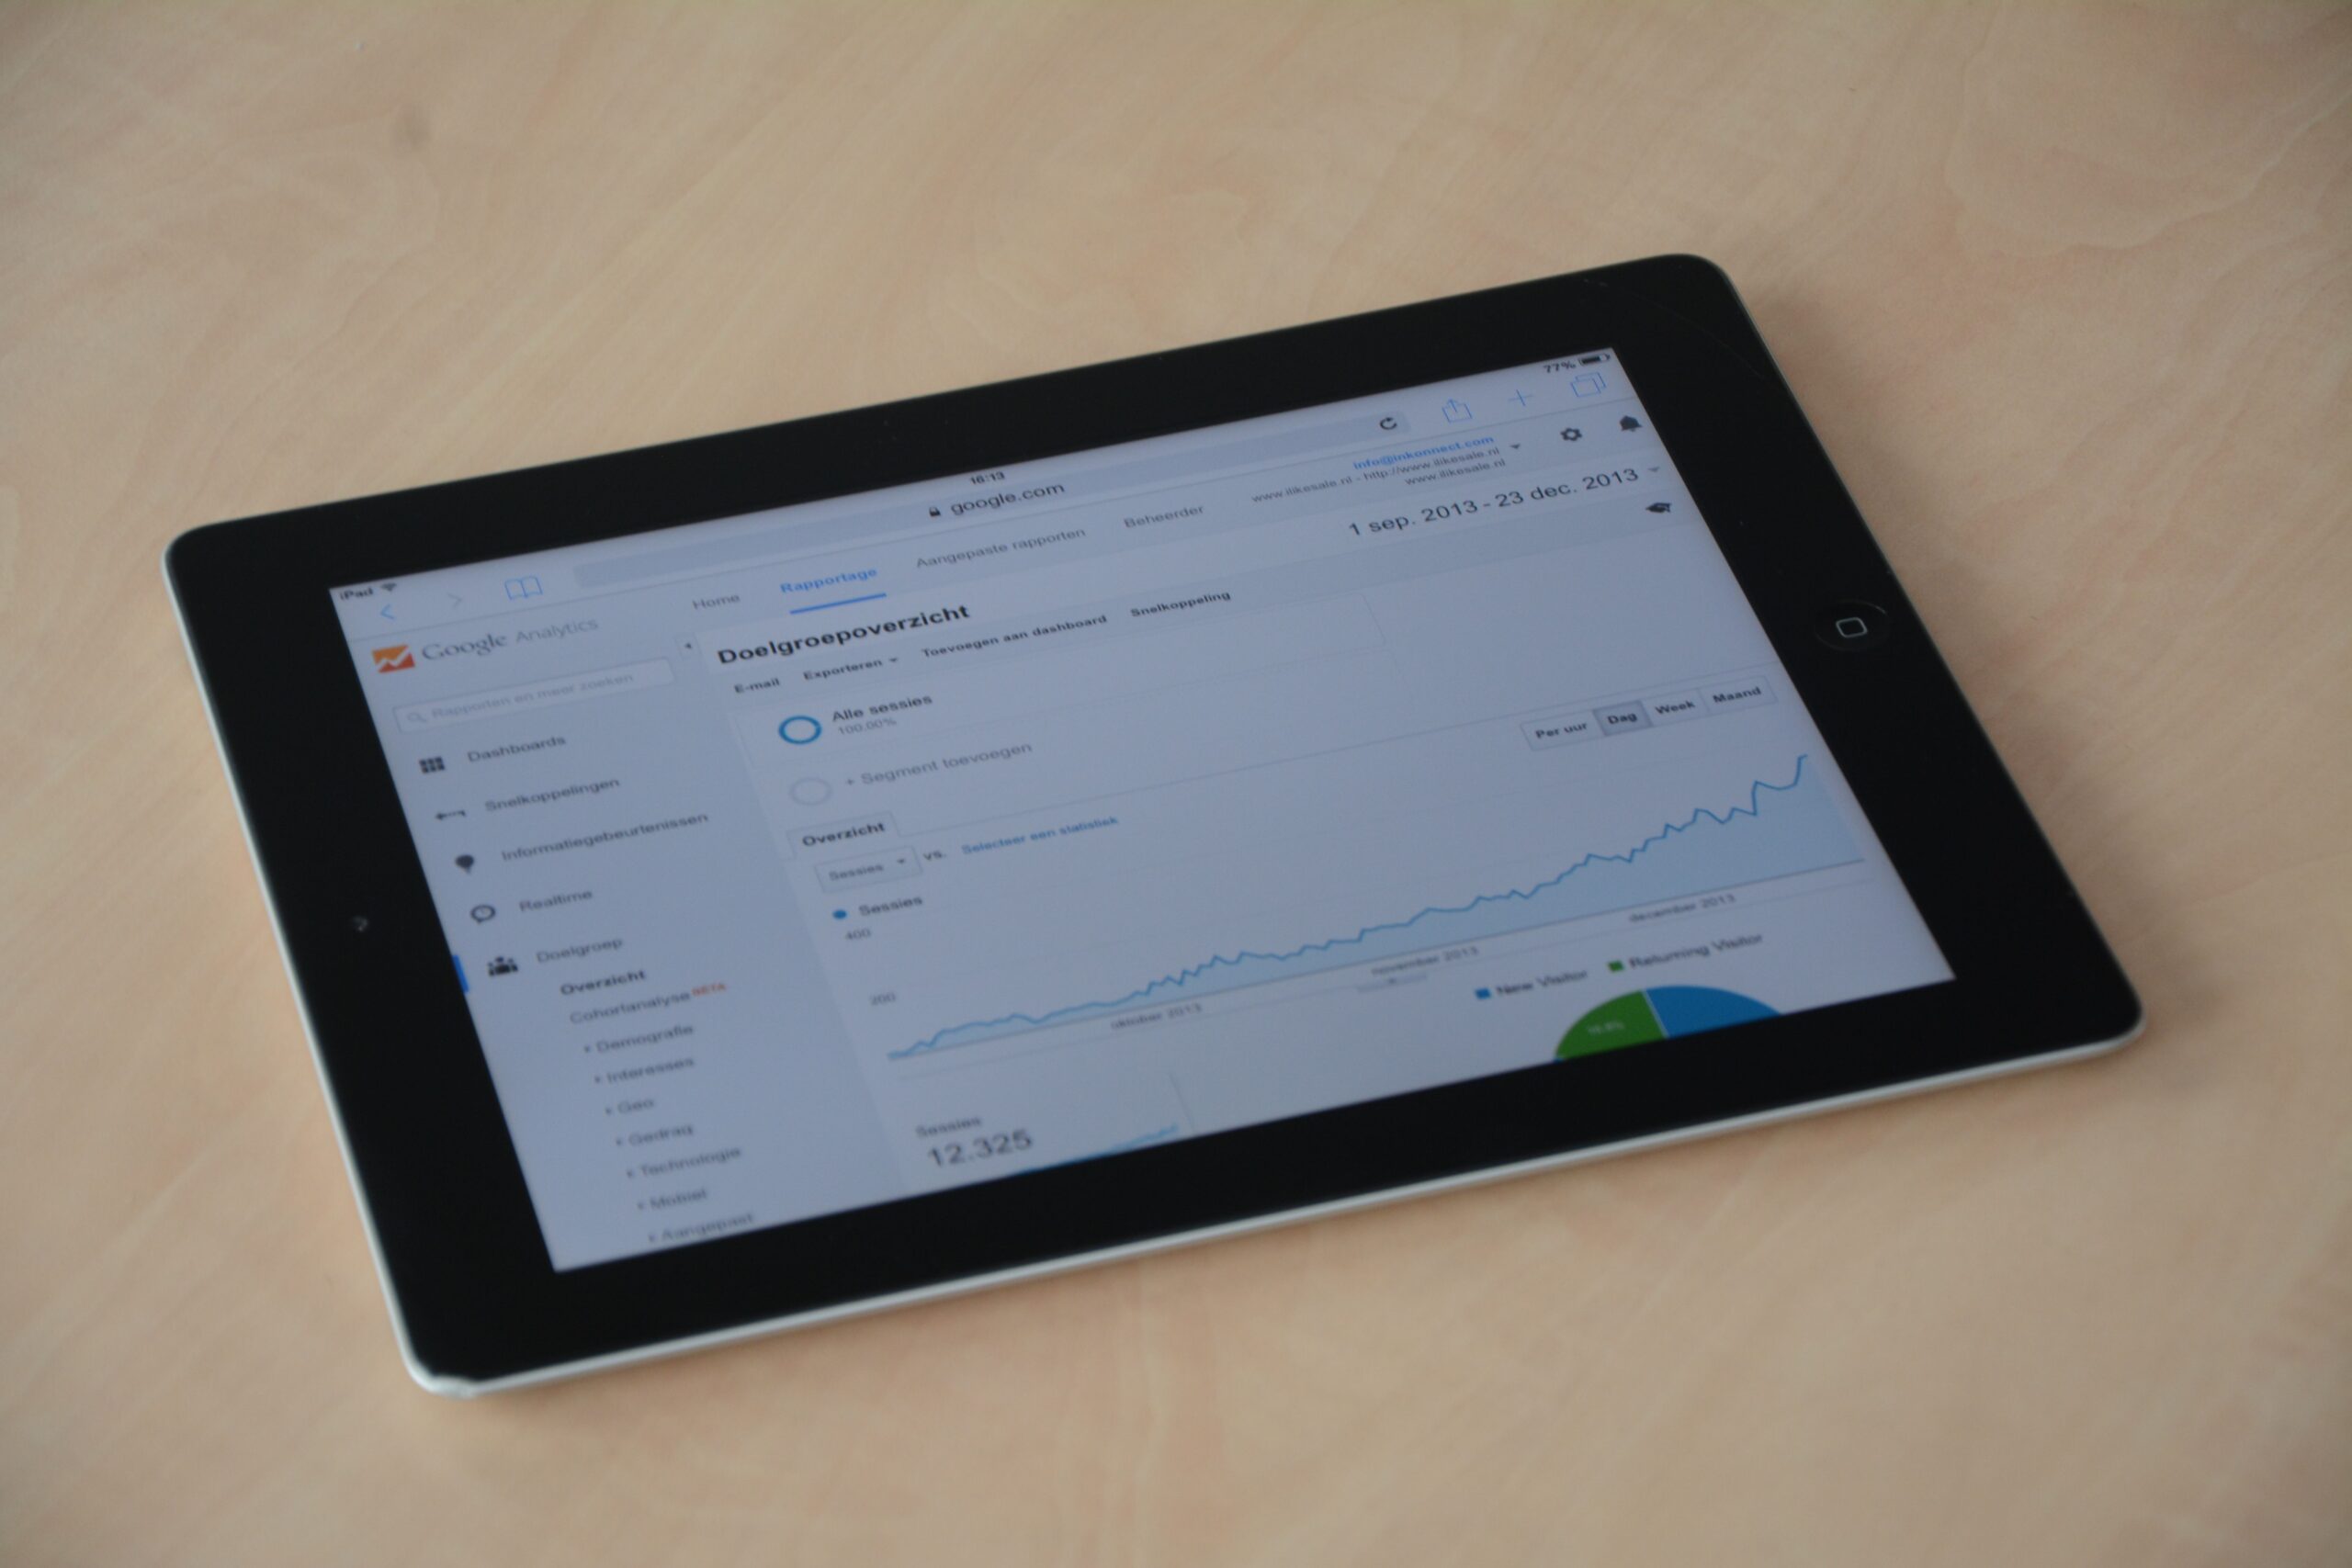
There’s also a real measurement wrinkle here. Search Engine Journal’s Vahan Petrosyan has pointed out that GA4’s bounce rate is the inverse of an “engaged session,” and an engaged session is satisfied by any of three conditions – ten seconds, a key event, or a second pageview – which means a visitor who lands, reads a static page for eleven seconds, and leaves without clicking anything now counts as “engaged,” while a nearly identical visitor who leaves at nine seconds counts as a full bounce. Comparing raw bounce-rate percentages across tools, industries, or even before-and-after a GA4 migration can quietly compare two different things. Industry bounce norms reflect this: content sites and blogs commonly run in the 65–90% range, because a reader arriving, getting an answer, and leaving is often the system working as intended, while e-commerce sites, where browsing multiple pages is part of shopping, typically sit closer to 20–45%. A 70% bounce rate on a recipe blog and a 70% bounce rate on a checkout funnel are not the same emergency.
What I’d actually fix first
If I were triaging a site with a genuinely bad abandonment problem – not the “good abandonment” kind, but visitors who look confused, frustrated, or bounced from a page that should have converted – I’d work in roughly this order, because each layer is cheaper to fix than the next:
- Message match first. Does the headline repeat the language that got someone to click in the first place? A mismatch between an ad or search result and the landing page is often the single biggest lever, and it costs nothing but a rewrite.
- Then the first-screen credibility check. Real photos instead of generic stock, a visible phone number or address, no typos in the hero section – the cheap fixes the Stanford data says carry outsized weight.
- Then mobile interaction, specifically. Test on an actual phone, on cellular data, and watch for dead taps and cramped buttons before touching a line of backend code.
- Then load time – still worth fixing, still worth testing against Core Web Vitals, just no longer the guaranteed differentiator it was five years ago.
- Then, and only then, the deeper technical and structural audit – crawl errors, redirect chains, server response time – the kind of diagnostic work that usually needs a proper toolset rather than a gut check. This is the point where bringing in a dedicated SEO Company to run a full technical audit tends to pay for itself, because a lot of the deeper issues (broken internal links, poor crawl structure, orphaned pages) are invisible from the front end but still shape whether Google – and visitors arriving from it – ever get a good first impression at all.

Frequently asked
What’s a good bounce rate? There isn’t one universal number – a “good” rate for an e-commerce store (roughly 20–45%) would be a five-alarm fire for a SaaS pricing page and perfectly normal for a blog. Compare your pages against their own history and against similar page types, not against an industry-wide average pulled from a different kind of site.
Does page speed still matter as much as everyone says? Yes, but it’s increasingly a baseline requirement rather than a competitive edge – nearly half of mobile sites now pass Google’s Core Web Vitals thresholds, so a fast site earns you parity, not necessarily an advantage, while a slow one still actively costs you visitors.
Can a popup alone cause a fast exit? An aggressive one, yes – especially on mobile, where Google has penalized intrusive interstitials in search rankings for years. Delayed, scroll-triggered, or exit-intent prompts cause far less damage than anything that fires before the visitor has had a chance to read.
How this article was put together: the figures above come from Google Analytics’ own published documentation on engaged sessions, Gitte Lindgaard’s 2006 peer-reviewed study on visual appeal judgments, Stanford’s Persuasive Technology Lab credibility research, Nielsen Norman Group’s page-visit research, and 2026 performance benchmark reports from Searchlab, LogicMonitor, and Contentsquare, all checked in August 2026. Bounce-rate benchmarks by industry vary meaningfully by methodology and should be read as orientation rather than a fixed target – recheck them against your own site’s history rather than treating any published range as gospel.