


Companies can use data analytics to improve operations by turning everyday business data into better decisions about demand, staffing, inventory, maintenance, quality, service, and cost control. In 2026, the strongest gains usually come from focused projects: forecasting demand more accurately, finding process delays, predicting equipment failure, routing service requests faster, spotting payment exceptions, and showing managers which actions changed key performance indicators.
The timing matters because AI and analytics are moving from pilots into routine work. U.S. Census Bureau data collected from December 2025 to May 2026 found that AI use among U.S. businesses hovered between 17% and 20%, while 37% of firms with at least 250 employees reported using AI in business operations, according to the Census Bureau’s business survey.
What Data Analytics Means For Operations
Data analytics in operations means collecting, cleaning, comparing, and modeling business data so managers can make faster and more accurate decisions. IBM defines big data analytics as systematic processing and analysis of large and complex data sets to extract insights, patterns, and correlations for data-informed decisions through big data analytics.
For operations teams, analytics usually answers 4 questions: what happened, why it happened, what may happen next, and what action should follow. The output may be a dashboard, forecast, alert, workflow rule, or AI-generated recommendation. The format matters less than the decision it improves.
| Operations area | Data sources | Better decision | KPI to track |
| Demand planning | Sales history, promotions, weather, local events | Order more or less inventory | Forecast error, stockout rate |
| Maintenance | IoT sensors, machine logs, CMMS records | Service equipment before failure | Downtime hours, maintenance cost |
| Workforce scheduling | Labor hours, foot traffic, order volume | Match staffing to demand | Overtime, service level |
| Quality control | Inspection data, defect codes, supplier lots | Find root causes earlier | Defect rate, rework cost |
| Finance operations | Invoices, payments, purchase orders | Flag duplicates and exceptions | Days payable, leakage rate |
The goal is not a prettier dashboard. The goal is a repeatable decision loop: reliable data, clear metric, accountable owner, recommended action, measured result.
When dashboards become part of daily decision-making, teams may also need formal training through a Power BI course, so reports are built around real business questions instead of disconnected charts.
How Much Can Analytics Improve Operations?

Analytics can improve operations meaningfully, but results depend on data quality, workflow adoption, and whether managers act on the insight. McKinsey reports that AI-driven forecasting in supply chain settings can reduce forecast errors by 20% to 50%, cut lost sales and product unavailability by up to 65%, reduce warehousing costs by 5% to 10%, and lower administration costs by 25% to 40% through AI-driven operations forecasting.
Those ranges are not guaranteed. A company with clean transaction data, stable product categories, and managers willing to change ordering rules will usually move faster than a company with fragmented spreadsheets and no shared definition of “late order.”
Predictive maintenance follows the same logic. Deloitte’s predictive maintenance guidance describes how companies can use connected equipment data to optimize operations in real time, anticipate failures, extend asset life, and reduce disruption. For a factory, fleet operator, utility, or warehouse, an early warning signal can be more valuable than a monthly report because downtime often creates labor delays, missed orders, penalty costs, and safety risk.
How Should Companies Start?
Companies should start with one costly operational problem, not a broad “data transformation” plan. A narrow project gives teams a visible baseline and a clearer way to prove value.
Good first projects usually have a few traits:
- A named business owner
- A measurable baseline
- A decision that can change every day or every week
Examples include excess overtime in 3 warehouses, recurring stockouts in the top 50 SKUs, scrap rate on one production line, or slow invoice approvals in one region. Each problem already has a cost attached. That makes analytics easier to fund and easier to judge.
Define The Metric Before The Model
A forecast model cannot help if teams disagree on the metric. For example, “on-time delivery” may mean delivery by promised day, delivery within a 2-hour window, or delivery before a customer penalty applies. Each definition changes the data, model target, and operational action.
Useful operating metrics often include cycle time, error rate, downtime, forecast accuracy, cost per order, first-pass yield, and service level. The best metric is the one a manager can influence quickly. Quarterly profit matters, but a warehouse supervisor needs daily signals such as picks per labor hour, delayed orders, or missed scan events.
Connect Data From Daily Work Systems
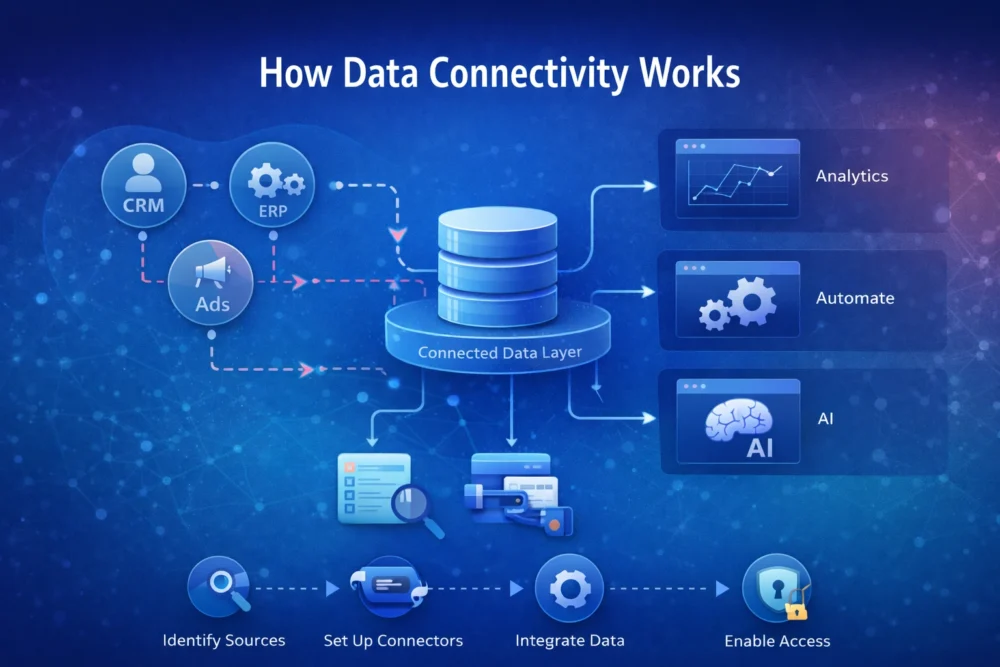
Most companies already have usable operational data inside ERP, CRM, point-of-sale, warehouse management, HR, finance, maintenance, and support systems. Sensor data, delivery scans, call transcripts, and email queues can add detail, but leaders should resist collecting more data before fixing basic quality issues.
Common problems include duplicate customer records, missing timestamps, inconsistent product names, old supplier codes, and manual spreadsheet overrides. Cleaning those issues may create more value than adding another platform.
After the data is stable, companies can connect analytics directly into workflows. A demand model can recommend extra stock before orders spike. A support model can route an angry customer to a senior agent before churn risk rises. A maintenance model can create a work order before vibration crosses a risk threshold. A finance model can block a duplicate invoice before payment leaves the account.
Use AI Carefully In 2026 Operations
AI can extend analytics by reading unstructured data, detecting patterns, generating forecasts, recommending actions, and automating routine decisions. McKinsey’s 2025 global survey found that 88% of respondents reported regular AI use in at least one business function, up from 78% a year earlier, yet only 39% reported enterprise-level EBIT impact in The State of AI.
The lesson for operations leaders is clear: adoption is easier than value capture. Deloitte’s 2026 AI enterprise research also found a gap between ambition and realized revenue, with 74% of organizations hoping to grow revenue through AI initiatives in the future compared with 20% already doing so in its 2026 AI report.
For operations, AI should be judged by operational metrics, not novelty. A warehouse AI tool should reduce picking errors, overtime, or shipment delays. A customer-service AI tool should improve resolution time or quality scores. A procurement AI tool should reduce maverick spend, supplier risk, or late purchase orders.
Governance Keeps Analytics Safe Enough To Use
Good analytics needs governance because bad data, hidden bias, poor access control, and weak security can create real business harm. IBM’s 2025 data breach report lists the global average breach cost at $4.4 million and warns that racing to adopt AI without security and governance can increase data and reputation risk.
NIST’s AI Risk Management Framework gives organizations voluntary guidance for managing AI risks and building trustworthiness into AI products, services, and systems through the AI Risk Management Framework. In practical terms, companies should assign data owners, limit sensitive-data access, document model assumptions, review automated decisions, and monitor model drift.
Governance should not slow every project. It should make analytics safe enough to use in real workflows.
Skills Matter More Than The Tool Stack
A modern analytics stack can include a cloud data warehouse, BI platform, data lakehouse, machine learning tools, process mining software, and AI agents. Tools still fail when teams do not trust the output or do not know how to use it.
The World Economic Forum’s Future of Jobs Report 2025 gathered views from more than 1,000 global employers representing over 14 million workers, and examined workforce shifts from 2025 to 2030 in its Future of Jobs Report. For operations teams, that signal matters because analytics work depends on people who can connect data, process knowledge, risk judgment, and day-to-day decisions.
For operators, the best training is tied to actual work. A planner should learn why a forecast changed. A maintenance supervisor should learn how to inspect a model-generated alert. A finance manager should learn when to override an exception flag and when to escalate it.
Common Mistakes To Avoid
Analytics projects often miss value because teams treat data as a technology project rather than an operating change. Common mistakes include building dashboards without changing decisions, tracking too many metrics, automating bad processes, letting departments define metrics differently, ignoring frontline staff, and measuring model accuracy without measuring business impact.
A practical rule helps: every analytics output should answer, “Who acts, when, and what changes?”
Summary

Companies can use data analytics to improve operations by linking reliable data to specific decisions in forecasting, maintenance, staffing, quality, service, logistics, finance, and risk control.
In 2026, the advantage goes to companies that treat analytics as an operating system for daily work, not a side project for reporting. Start with one costly bottleneck, define the metric, connect the right data, test the decision loop, govern the risk, and measure the operational result.